Map
MapReport Generator
Get a demo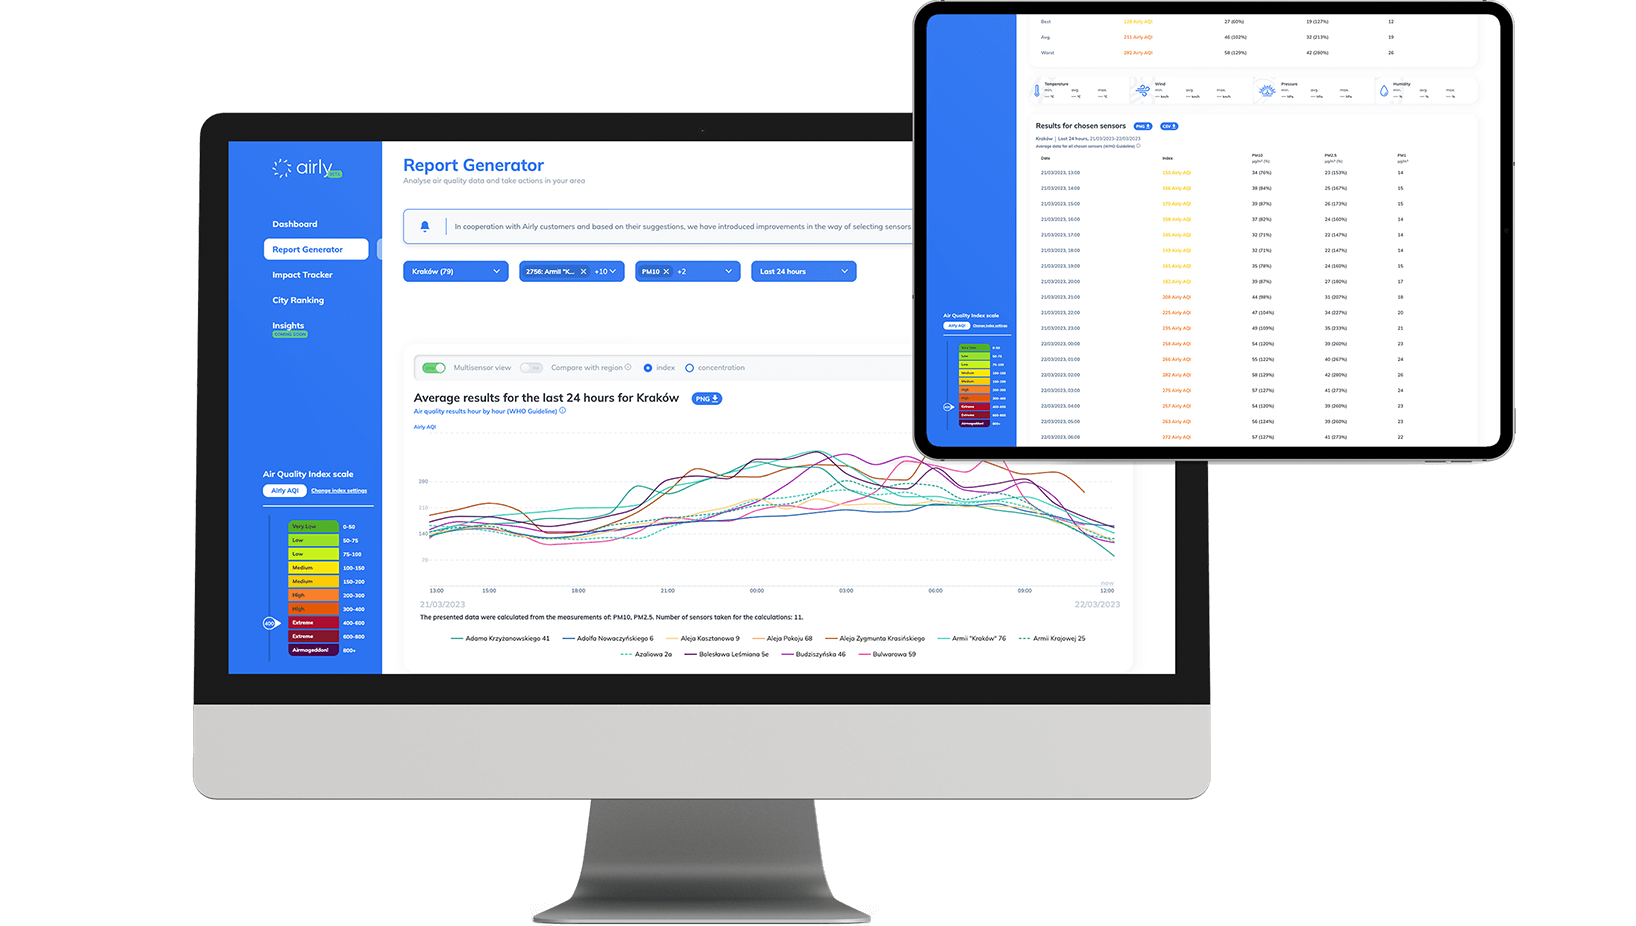
Review your sensors network
Allows more complex view of the air quality results, a customer can see all sensors in a chosen city at once on the sensors list. The sensors list presents:
- sensor ID,
- sensor's location with sorting A-Z, Z-A option,
- the chosen air quality index,
- the trend for a specific sensor (based on comparison to the previous time period - 24h, 7 days, 30 days, 365 days),
- the sensor status (active/inactive).

Air Quality charts
Ready to-be-downloaded Air Quality Charts allow a customer to:
- analyse air quality data for a given sensor or a group of sensors in time,
- compare air quality results to a region,
- track trends and progress or regress for a specific pollutant or a group of pollutants,
- analyse air quality results hour by hour and day by day for a predefined and custom period of time.
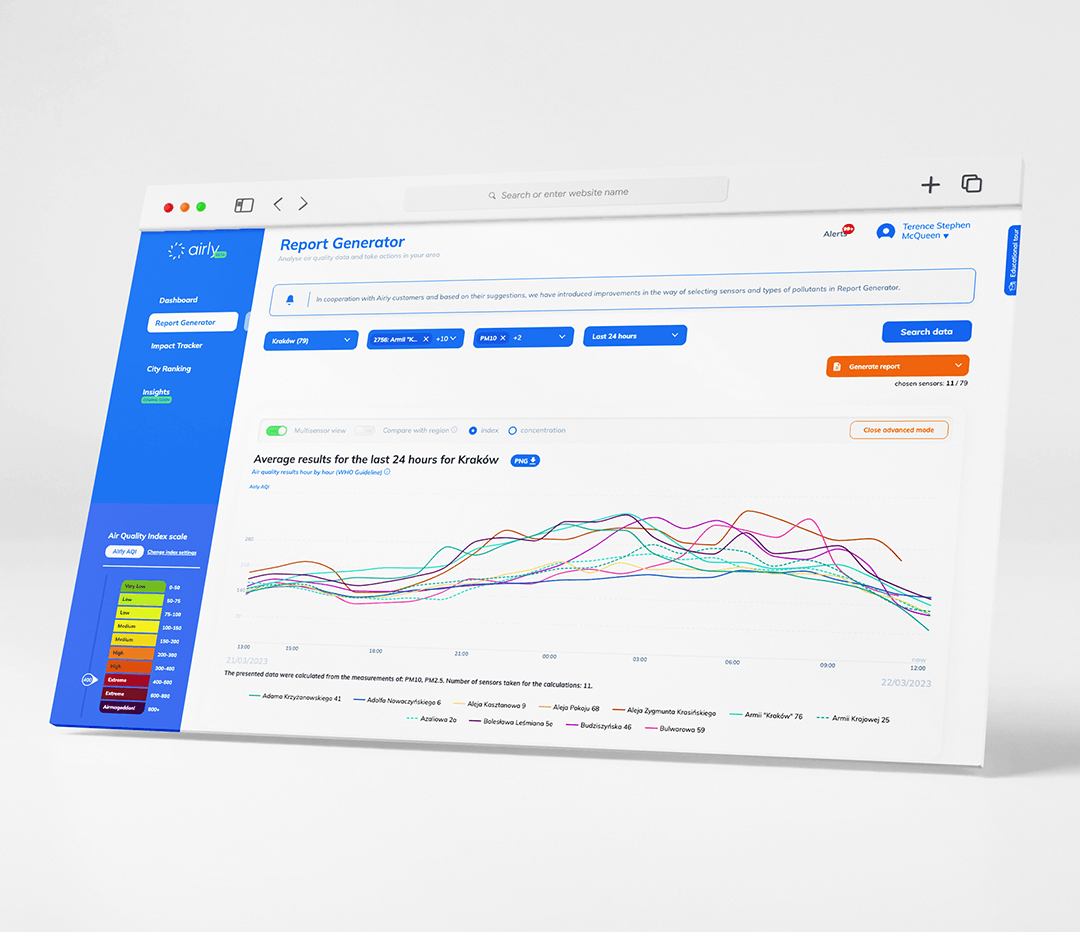
Report Generator features
Report Generator was created for customers who work with air quality data on a daily basis. The comprehensive set of filters allow customers to:
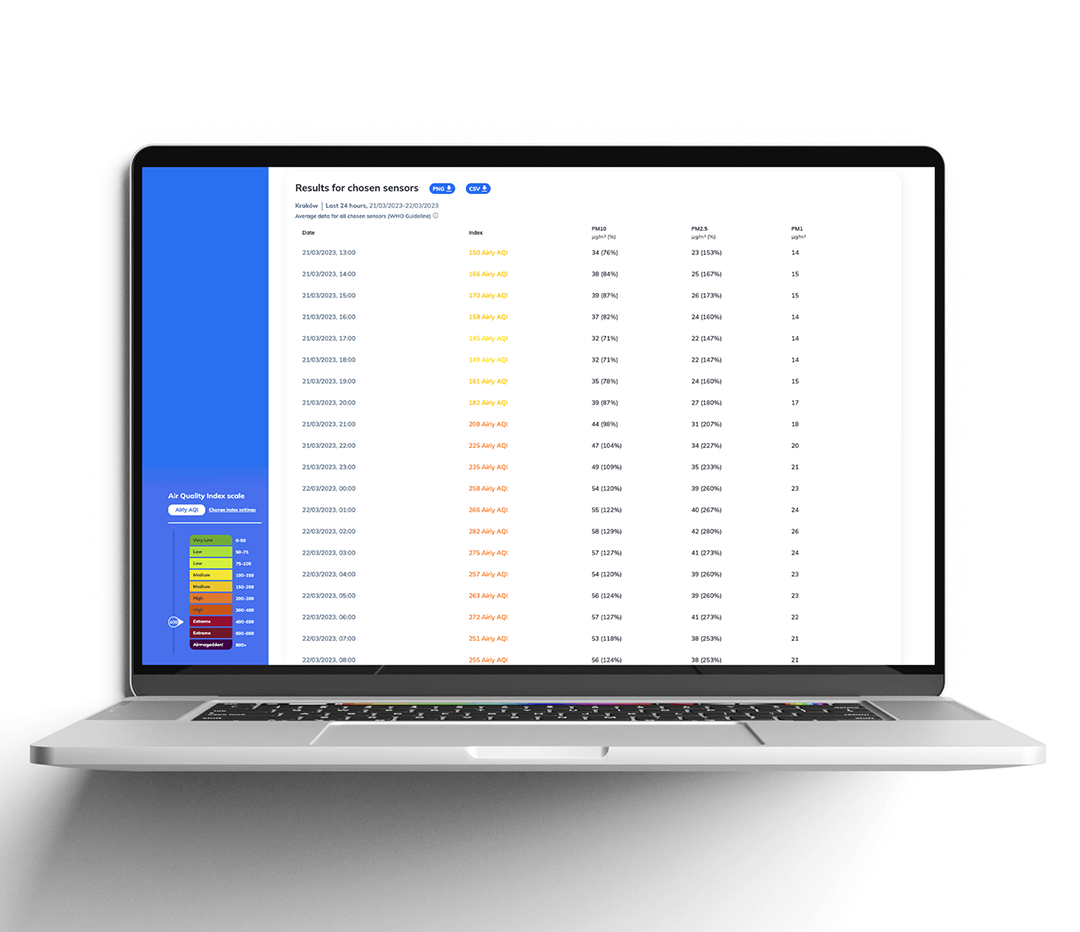
- search data by cities, locations, pollutants in a predefined or custom period of time,
- analyse air quality data thanks to various charts that show user-selected data ranges and dimensions,
- analyse trends and insights created automatically based on the results,
- benchmark specific set of data to a region,
- download air quality data to CSV and PNG files.